Introduction
Much debate goes on with the financial pundits, banks and retail investors as to whether the Fed will soon pivot, or whether they will follow through on promises to continue hiking rates and to also tighten their balance sheet as promised.
In no uncertain terms, the Feds Mester said not to expect rate cuts throughout the remainder of 2022 and the duration of 2023. At Jackson Hole, Powells terse speech on “pain” was in stark contrast to the bank analysts and financial pundits’ predictions of a dovish Fed speech.
We have announcements of $95 billion a month roll off of the Fed balance sheet for the remainder of 2022, for a total of $380 billion into Q4 2022 and year end.
While many retail measures of sentiment have hit extremes in bearish sentiment repeatedly in 2022, retail remains invested at record levels, expecting that they can just “ride it out”. Each lower low is expected to be the bottom.
Retail investors, as has been much discussed, have been engaged in a game of chicken with the Fed. Central Banks worldwide have been engaged in repeated currency swap manipulations that have distorted price action in the VIX, paper oil futures, stocks themselves - and also the perception of reality for most traders.
Thus far they have controlled the move lower rather precisely, but at the expense of the lower and middle class worldwide. Inflation has not been tamed.
It is extremely important that we remain flexible, objective in our views and guard against our emotions getting out of control.
This market is the perfect type of market for encouraging traders to “buy high and sell low”. That is most often a losing proposition. “Buying the dip” worked pretty well in a bull market involving constant QE (loose money) and low rates.
And yet - the same banks who were calling for targets in the 5000s early in 2022 when it was obvious in the charts that there was extreme downside risk, now call for much lower targets just as the markets reach extreme oversold levels and temporary bottoms. This encourages anyone listening to them to buy or sell at the worst possible times.
Much of the debate within the trading and investment community centers on whether they (Fed) will follow through on promises to continue hiking and tightening. I don’t have a crystal ball, so I can’t say 100%.
What I can say is that they (Central Banks) are trapped. CPI may shed a little light on the subject, but these numbers are “massaged” without a doubt. In the real world, we can see that they don’t remotely reflect reality.
I am still observing constantly rising food prices at a rapid rate. I hear stories on a regular basis of sudden massive increases in rents. Home prices are massively inflated, with rates still rising, and home inventories also rising. Energy is in tight supply versus what the paper futures markets are telling us, with many seeing a scenario where they may have to choose between food or heat during the winter.
There is one thing that changes sentiment to a degree that demand and consumption are reduced across the board… big stock market losses. While the Fed may not want a crash, they actually need recessionary pressures and a massive repricing of the stock markets.
With things spiraling quickly out of control for consumers globally, the Central Banks try to thread the needle and manufacture a “soft landing”. For many, pain has already been here for a while. I believe Jerome Powell when he says pain is needed. The Fed has avoided short-term pain for far too long.
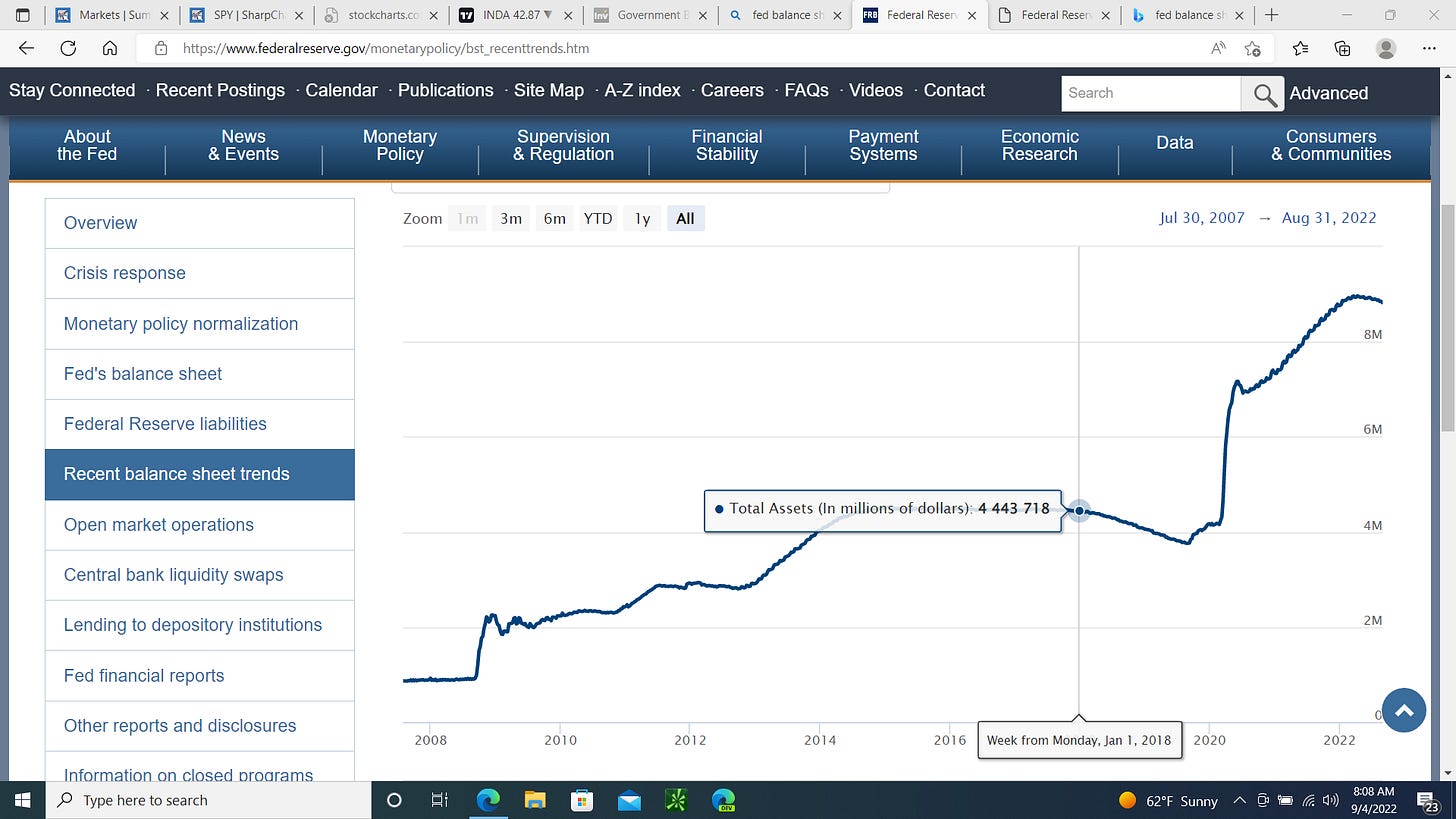
For sure, the debate on what the Fed will do will continue until it can’t be refuted anymore. I will just share here a couple of shots of the Fed balance sheet at key points in time. There is something to note here that can’t be denied.
Into 2018 (with rates not in an aggressive hiking cycle as they are today) the Fed engaged in some moderate tightening of the balance sheet. We got “Volmageddon” and the late 2018 mini crash. This tightening is shown in the first Fed balance sheet chart below with the date January 1, 2018 noted.
Below is the massively elevated Fed balance sheet into 2022, date noted of January 3, 2022. In late 2021, they spoke of QT and the balance sheet began to roll over just slightly. Markets responded with SPX putting one of its worse yearly starts in many years, entering a bear market and dropping from 4800 to 3630.
Below the Fed balance sheet date noted is March 9, 2020. We can all try to argue it, but this is the current primary source of inflation and wealth transfer, inequality. The balance sheet exploded and so did the stock markets (and inflation).
The markets response to this exploding balance sheet is obvious. The Fed is directly tied to the markets more than ever before. I don’t believe they really want to be connected with stock markets to this degree, hence Jerome Powell’s Arthur Burns comment.
Charts - SPY
So, the debate is - Fed will pivot? Or will opt for staying the course that they have communicated to traders… Pain?
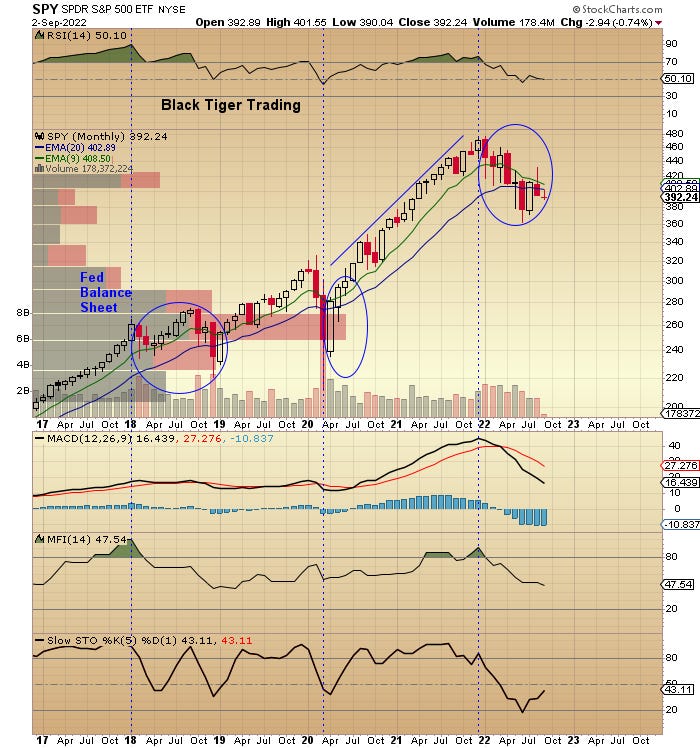
Let’s just look for a minute at how closely the market is tied to the Fed balance sheet. Obviously, none of us can say for sure what they will do before they do it, but… they have made rather clear their intentions.
The first slight tightening I showed above on the Fed balance sheet charts occurred into 2018. Here on the SPY chart, we can see that even without aggressively hiking rates as they are currently, this slight tightening in 2018 put the markets under severe stress. This is noted by the first vertical line and circle where it says Fed balance sheet.
The response to this slight tightening without aggressive hikes caused a scramble by the President, Fed and Treasury at the end of 2018 to save markets.
The next vertical line and circle represents the Fed balance sheet chart showing the March 9, 2020 point in time. The balance sheet exploded in a way it never has in just four short weeks. In response, the markets exploded to the recent all-time highs by late 2021.
In late 2021, there was talk of quantitative tightening and rate hikes and the Fed balance sheet began to roll over just slightly. The final vertical line and circle represents the Fed balance sheet with the January 3, 2022 point in time. The market response has already been dramatic relative to this.
We’ve really only just started down the path the Fed is indicating for both interest rate hikes and quantitative tightening (removing liquidity, money supply). A bullish buy and hold strategy here seems at best risky, at worst - foolish.
This is a bet that the Fed will not follow through, when their current communication indicates that they have every intention of doing so.
While the markets often respond abruptly these changes in Fed monetary policy, there is a lag in both the economic data and the economy’s response to these changes. Here we are today, traders denying that the Fed will do what they say. And yet, the Fed and their desire to tame runaway inflation seem completely counter to what many investors/traders believe and the actions they continue to take with respect to risk.
What can we do?
My analysis says this:
We should hold larger cash positions.
We should manage actively.
We should remain flexible in our views on whether to be primarily long or short.
Our position sizes should be smaller.
We should look for extremes in the price action and our key indicators before going heavily long or short.
We should maintain some exposure to physical gold, in the event this grand experiment goes completely haywire.
We should consume and spend less.
Charts Technical Perspective
I will keep this one straight forward. I have shared many charts and where we are relative to the technical indicators and moving averages. On the SPY chart and many others, we can see that the moving averages are stack bearishly. As I noted I expected we would, SPY and these other charts failed precisely at the daily 200 SMA.
SPY failed at the 50-week EMA and at the 20-month EMA. While there may be bounces, the primary trend is down currently with the large daily, weekly and monthly charts aligned. My bias for positioning continues to be primarily short off the daily 200 SMA breakdown.
We did not see the heavy professional buying volume at the SPY bottom near the 362.03 level, like we saw at the 2018, 2020 bottoms. The difference is likely what I noted - current Fed monetary policy. Hiking and tightening still seems to be currently accepted as legitimate by the actions of the big smart money.
Of course, we know retail traders who have been in the markets for 1-3 years are much smarter today… Or are they?
We will not know the verdict for sure regarding the until the Fed balance sheet shows the proposed tightening occurring. We will not know if the market goes to a lower low until the current low is broken.
But based on the daily, weekly and monthly technical indicators as well as the volume and smart money flows, it looks like we failed at the 20-month EMA and confirmed it as resistance. It looks as if we are headed down to test new, lower levels.
~ Scott - Black Tiger Trading
Disclaimer: I am not a licensed adviser. Trade ideas, strategies, analysis are shared for educational purposes. Trade involves risk of loss of capital. Accordingly, trade at your own risk.


